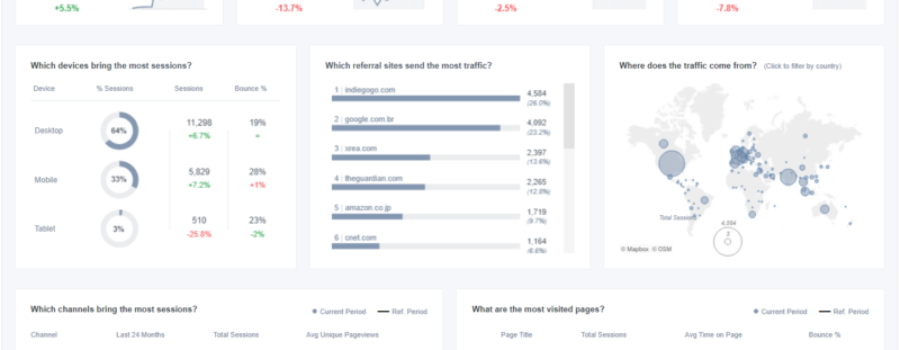
A dashboard is a user interface that displays important information in an organized and easy-to-read format. Dashboards are used in a variety of contexts, including business, finance, and operations, to provide a quick overview of key metrics and performance indicators. They can be used to monitor and analyze data in real-time, and can also be used to create reports and visualizations.
Dashboards can be interactive, allowing users to filter, drill down, and explore the data. They can be created using a variety of tools, such as Excel, Tableau, PowerBI, Looker, and many others. Some dashboards are web-based, and can be accessed from any device with an internet connection, while others are installed on a computer or local network.
In the context of data engineering, dashboards are often used to visualize data from the data warehousing and data processing systems, giving insights to the business and stakeholders. They can also be used to monitor the performance of the data engineering ecosystem and its components, such as data pipelines, storage systems, and processing frameworks.


